Data
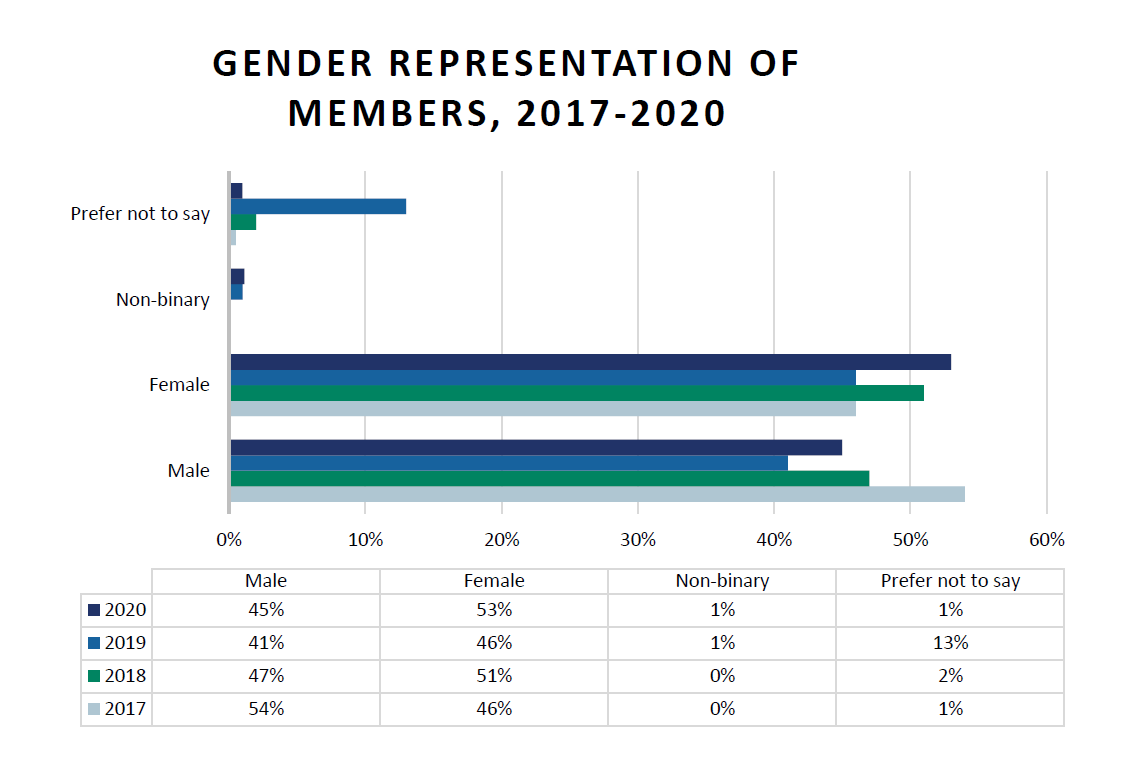
We regularly invite members and delegates to complete Equality, Diversity and Inclusion surveys, to help us improve our plans to include our entire community in our initiatives. We have been collecting data about gender identity since 2013 and have also asked individuals to share details regarding their career stage, ethnicity, disabilities, long term illnesses or impairments and sexual orientation since 2018.
Unfortunately, the response rates to our most recent surveys were too low to accurately represent our membership and so we are currently looking at other ways of collecting this data. As a result, our most recent survey results are from 2020.
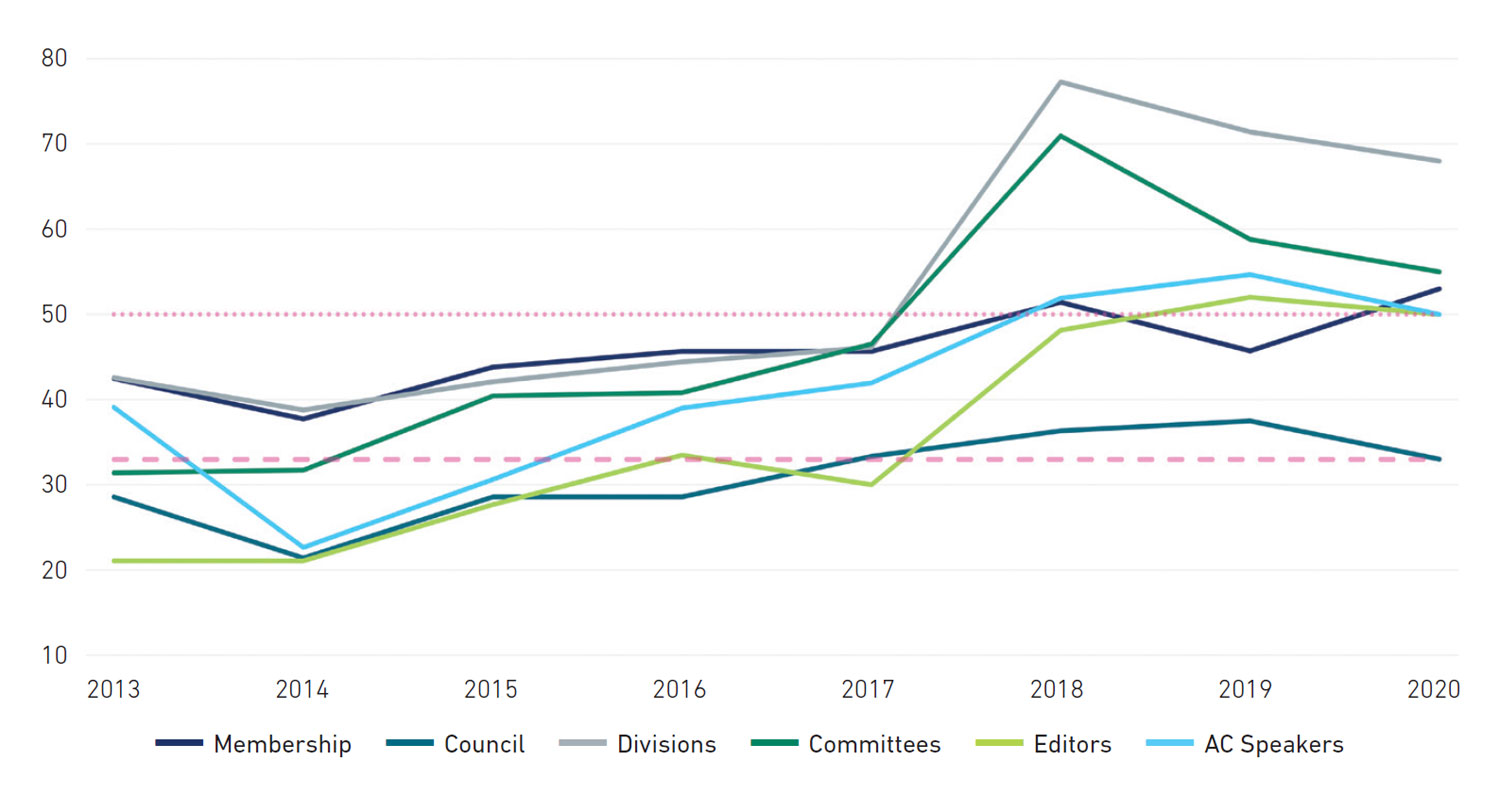
Representation of women over time
The graph below shows the representation of women over time in membership, Council, Divisions, Committees, Editorial Boards and Annual Conference (AC) speakers. Marker lines for 33% and 50% are provided for comparison.
Membership data for 2020
At the end of December 2020, there were 6,145 members of the Microbiology Society. Of a total of 810 respondents, 793 members and 17 non-members completed the survey; therefore, the member responses represent a 13% sample of the total membership.
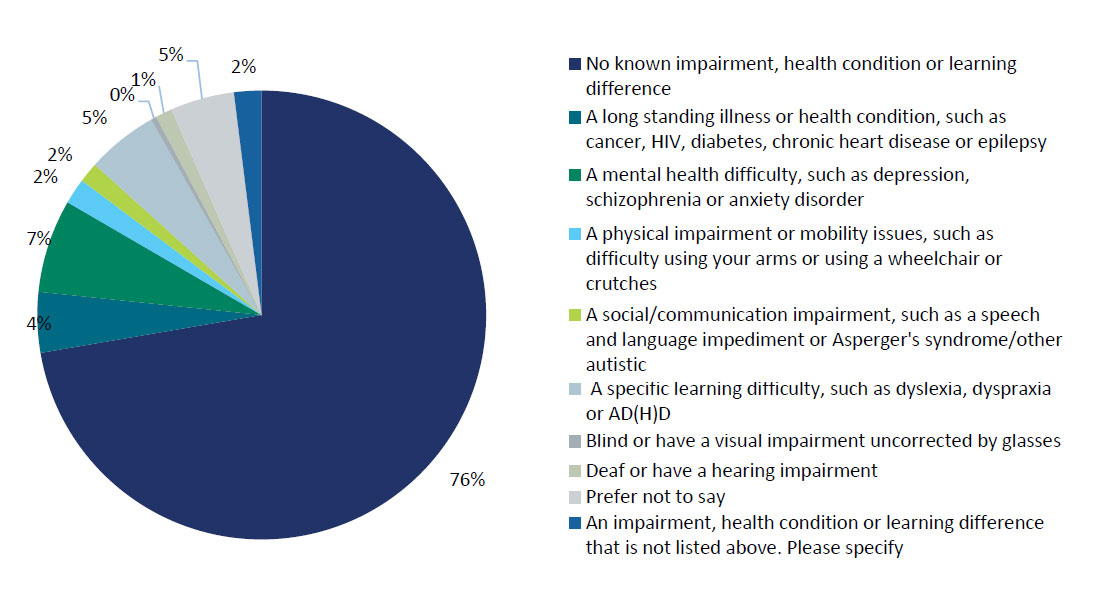
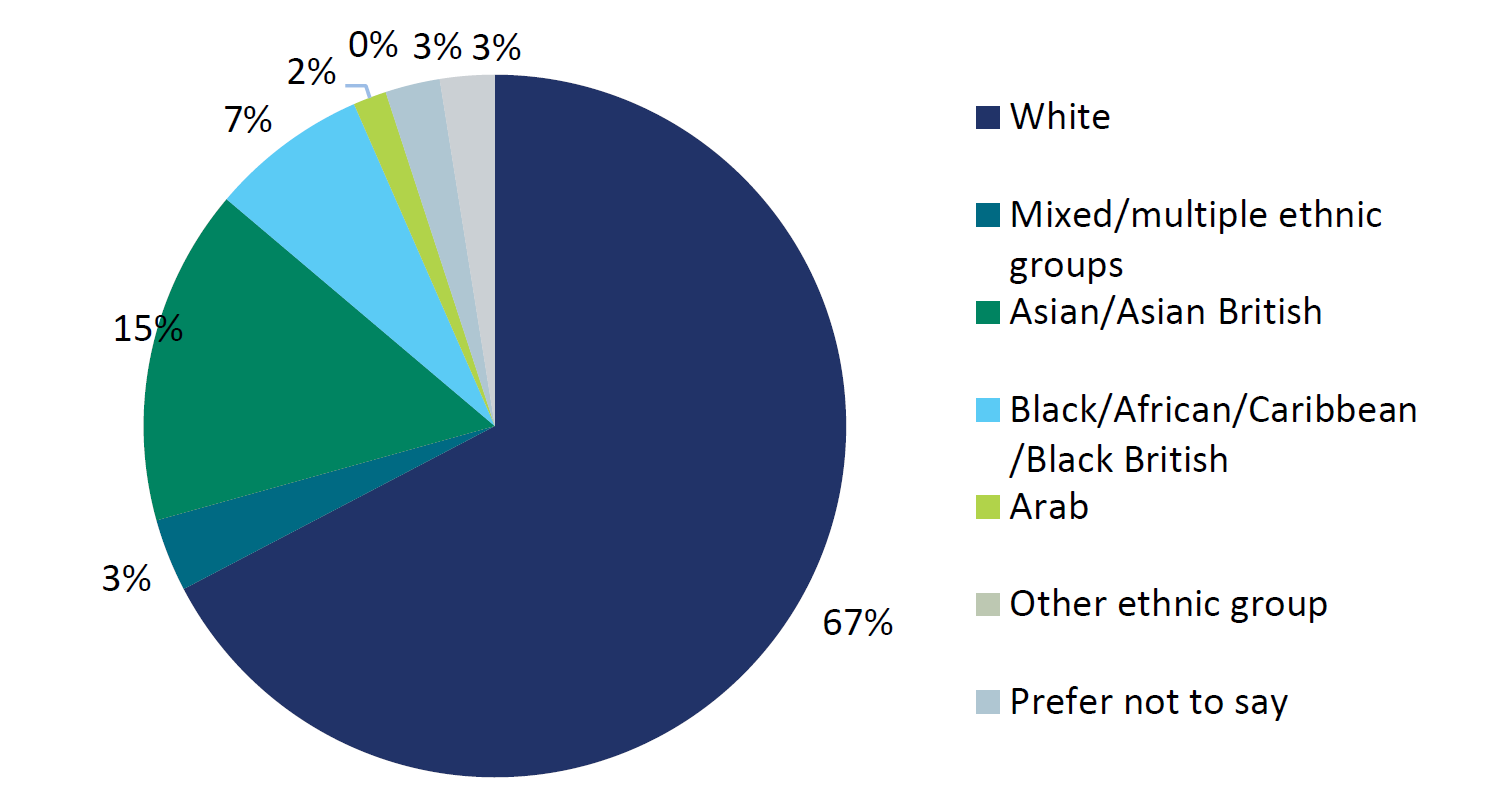
The data below shows how our members identified in terms of disabilities or impairments, ethnic background and gender. We expect those involved in organising activities for our community take into consideration these protected characteristics and to strive for fair representation.
Please note: we understand that some of the language used in the survey questions below is now out of date and we have since changed the options provided in our surveys to reflect this. We continue to review the language and data we collect to ensure it remains up-to-date.