Infrared sheds light on host–pathogen interaction
Issue: Light
11 August 2015 article

Fourier transform infrared spectroscopy analysis provides valuable information about how a pathogen affects and interacts with its host.
Infrared spectroscopy measures molecular vibrations
The infrared region is flanked by the visible region and the microwave region of the electromagnetic spectrum. The infrared region spans wavelengths between 780 nm and 1 mm and the frequency used in infrared spectra is expressed per convention as ‘wavenumber’, the number of waves per centimetre that equals to 12,000 and 10 cm–1.
Infrared spectroscopy takes advantage of the fact that molecules absorb infrared light of very specific resonant frequencies, which are characteristic of their molecular structure. When the frequency of the infrared light matches the frequency of an atomic bond or functional group, molecular vibration occurs. Depending on the molecular structure, a combination of several vibrational states is excited comprising molecular stretching, scissoring, rocking, wagging and twisting. The information about the absorbed energy at each frequency, the infrared spectrum, is obtained by scanning the intensity of infrared radiation before and after passage of the infrared beam through the sample. This can be achieved either by a ‘dispersive’ or ‘scanning monochromator’ approach, where only one frequency at the same time passes through the sample. Or, alternatively, the information at all frequencies is measured simultaneously using Fourier transform infrared spectroscopy (FTIR). The latter approach is preferentially employed due to improved speed and signal-to-noise ratio.
The bacterial metabolic fingerprint
A FTIR spectrum of intact microbial cells is like a unique fingerprint signature and the bacterial metabolic state can be determined from its spectrum. The FTIR spectroscopic patterns represent an overlap of all biochemical constituents of the bacterial cell including polysaccharides, proteins, nucleic acids and fatty acids. Spectral resolution is enhanced by derivative transformation resolving approximately 50 to 70 spectral features in the MID-infrared spectral range between 4,000 cm-1 and 400 cm-1. Assignments to functional groups and biomolecules are based on these specific absorption bands. These bands are primarily sensitive to compositional and quantitative differences of biochemical compounds. In addition, many absorption bands can also detect structural changes, intra- and intermolecular interactions (e.g. membrane fluidity) and conformational states such as protein secondary structures. In general, microbial FTIR spectra can be subdivided into several spectral windows based on their specific biochemical constituents, including fatty acid chains and phosphorus-containing biomolecules of membrane components (e.g. phospholipids), proteins and peptides of the bacterial cell as well as polysaccharides present in the cell wall and potentially the bacterial capsule.
Today, FTIR spectroscopy is commonly used for microbial species identification. However, due to its high discriminatory power, bacterial typing at subspecies level and strain characterisation is probably the most promising feature of microbial FTIR spectroscopy. Employing pattern recognition methods such as hierarchical cluster analysis (HCA), principal component analysis (PCA) and artificial neural network analysis (ANN) was shown to be useful to (1) study stress responses of bacteria in vitro, (2) characterise growth phenomena (e.g. media-, temperature-, phase-dependent), and (3) differentiate serotypes/phenotypes within a bacterial species.
Host–pathogen interaction followed by FTIR spectroscopy
Bacteria evolved the ability to quickly adapt to changing environments and developed a large array of mechanisms to evade or counteract host immune responses. The knowledge about the specific mechanism employed by a particular pathotype is important to develop an appropriate prevention and/or therapeutic strategy.
The emergence of specific phenotypes associated with persistence and chronicity of infection was described for the important human and animal pathogen Staphylococcus aureus. The so-called small-colony variants (SCVs) are slow-growing, frequently unstable subpopulations with increased resistance to antibiotics compared with the normal phenotype. FTIR spectroscopy was able to follow the dynamic processes of the revertible switching between SCVs and the normal phenotype. In addition, loss of capsular polysaccharide expression was shown to be an important feature associated with S. aureus chronicity. Immune-based assays are commonly performed to detect S. aureus capsular polysaccharide expression. However, chemometrics-assisted FTIR spectroscopy was shown to be an alternative to identify capsule- expressing (serotype 5 and 8) and non-expressing strains (NT) in a much faster, cheaper and easier way. As one can expect, spectroscopically relevant information was found to be limited to polysaccharides originated from the bacterial capsule. Both examples show that FTIR spectroscopy might be a valuable approach for tracking a bacterial phenotype in the infected host for diagnostic and research purposes and might provide important information about the progression of infection and host adaptive processes.
The development of metritis and endometritis of dairy cows is influenced by the diversity and the dynamics of the uterine micro-organisms. FTIR spectroscopy was used to follow the changing composition of microbiota during progression of the uterine clearance process of post-partum cows. Specific subtypes of Streptococcus uberis and the uterine health status categorised in different vaginal discharge scores were linked. Spectral ranges used for discrimination are associated to lipid, protein and polysaccharide biomolecular structures. It was shown that FTIR spectroscopy is able to discriminate between distinct biotypes within the same species occurring during progression of uterine clearance.
The food-borne human pathogen, Listeria monocytogenes, is one of the most widely used model organisms to study host–pathogen interaction and host adaptive mechanism. FTIR spectroscopy was used to monitor metabolic adaptations of this bacterium to three different mouse genotypes, showing a different extent of host infection susceptibility. The re-isolated bacteria derived from the specific host genetic backgrounds showed characteristic metabolic fingerprints associated with changes in the protein secondary structure of the bacterial cell. Multivariate statistical analysis of spectral data could clearly differentiate between the host-passaged bacteria and revealed a correlation between bacterial spectroscopic pattern and the host’s susceptibility to infection. However, after continued in vitro passaging of the pathogen on standard growth media the specific host signatures were not ingrained and disappeared, suggesting a revertible metabolic memory of the bacteria.
Summary
FTIR spectroscopy is a fast, economical and valuable tool to provide novel insight into the ability of pathogens to adapt to their host environment during the progression of infection. A better understanding of the unique bacterial metabolic fingerprint associated with the individual host and infection site may also help to develop personalised treatment concepts.
TOM GRUNERT
Institute of Microbiology, vetmeduni Vienna, Veterinaerplatz 1, 1210 Vienna, Austria
[email protected]
FURTHER READING
Becker, K. & others (2006). Fourier-transform infrared spectroscopic analysis is a powerful tool for studying the dynamic changes in Staphylococcus aureus small-colony variants. J Clin Microbiol 44, 3274–3278.
Grunert, T. & others (2014). Deciphering host genotype-specific impacts on the metabolic fingerprint of Listeria monocytogenes by FTIR spectroscopy. PLoS One 9, e115959.
Grunert, T. & others (2013). Rapid and reliable identification of Staphylococcus aureus capsular serotypes by means of artificial neural network-assisted Fourier transform infrared spectroscopy. J Clin Microbiol. 51, 2261–2266.
Naumann, D. (2000). In Encyclopedia of Analytical Chemistry, pp. 102–131. Edited by R. A. Meyers. Chichester: Wiley.
Wagener, K. & others (2014). Dynamics of uterine infections with Escherichia coli, Streptococcus uberis and Trueperella pyogenes in post-partum dairy cows and their association with clinical endometritis. Vet J 202, 527–532.
Wenning, M. & Scherer, S. (2013). Identification of microorganisms by FTIR spectroscopy: perspectives and limitations of the method. Appl Microbiol Biotechnol 97, 7111–7120.
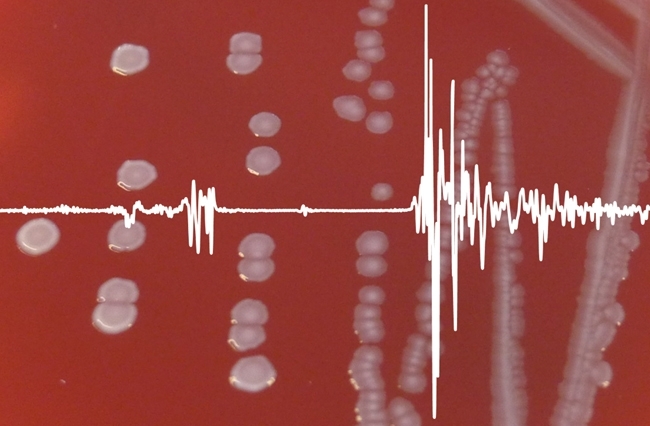
Image: Rainbow spectrum on textured background. Damocless/iStock/Thinkstock. Colonies of L. monocytogenes and a bacterial metabolic fingerprint. T. Grunert..