Imaging the topology of DNA
Posted on September 17, 2019 by James Provan
In March this year, James Provan, PhD student at the University of Glasgow was awarded a Research Visit Grant by the Microbiology Society. He used this grant to visit the lab of Dr Alice Pyne, expert in atomic force microscopy at University College London. Here, James describes his research and the findings he collected during his research visit to Dr Pyne's lab.


Despite how small DNA is, its size is a big problem for cells.
To illustrate, an Escherichia coli (E. coli) cell is around 2 micrometres long but its chromosome is roughly 1 millimetre in length if stretched end-to-end. This means its genome must be compacted several hundred times to fit! Adding to the complexity, the E. coli chromosome is circular in nature.
This compaction and circularity are studied in the field of DNA topology and are important factors in almost every cellular process that involves the DNA, such as replication, transcription, and recombination.
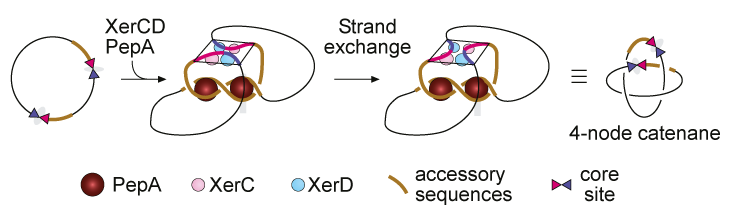
For my PhD at the University of Glasgow, I investigate the E. coli Xer site-specific recombination system. The Xer system is used by E. coli to ensure that its chromosome and certain plasmids (mobile DNA circles) are properly maintained.
The product DNA circles after Xer recombination are linked together in a topological form known as a ''catenane'' or a ''link''. The simplest DNA catenane would be two circles linked once, meaning it contains two crossings between the circles when laid flat against a surface. The ring logo of the Olympic Games is a composite of 5 catenated circles, with 2 crossings between each pair!
Since the model of Xer recombination was proposed in 1990s, most studies of the system have used gel electrophoresis techniques to separate the recombination reaction DNA products for analysis.
One of the central aims of my PhD was to take this Xer recombination system and make observations on a microscopic level. I identified atomic force microscopy (AFM) as an ideal technique. An atomic force microscope builds an image by using a nanometre-sized needle tip to ''feel'' the surface of a sample in a line-by-line way like a scanner. The difference of height, or topography, across a sample is interpreted by software and built into an image. This image has a resolution down to 0.2 nm/pixel – for comparison the DNA helix is roughly 2 nm in diameter.
I first met Dr Alice Pyne in September 2017 at a European Molecular Biology Organisation (EMBO) DNA Topology conference. Dr Pyne is a leader in the field of DNA AFM, and I developed a collaboration with her. She suggested that a placement in her lab would be best if I wanted to learn how to use DNA AFM and collect data for my thesis.
As a Microbiology Society member, I had already heard about Research Visit Grants. My project subject seemed very different to the previously funded projects, but a couple of months after applying I heard back that I had been successful! The visit grant would cover travel, accommodation, and lab reagents for a 30 day visit to Alice’s lab at University College London.
By using AFM, I hoped to verify that Xer recombination DNA products are four-crossing catenanes. Looking back now I vastly overestimated how much I could image by AFM in a month while learning the ropes!
Alice supervised me closely at the beginning of my visit, explaining the intricacies of AFM sample and microscope setup. In the later weeks I spent a lot of time working alongside other PhD students and learned about the DNA AFM project of Alice’s own PhD student, Kavit, who was a massive help with fine-tuning my scans.
AFM of DNA is slow and extremely sensitive to contaminants. Each DNA sample takes roughly 30 minutes to prepare, and the microscope is re-calibrated for each sample. First, I’d do a wide-field low‑resolution scan that identifies DNA molecules of interest, followed by smaller field high-resolution scans. High-resolution scans took six minutes each, then I would move around the field to find other molecules to capture. When there were issues with the scanning quality, it was an enormous chore. Several days of my visit were consumed by troubleshooting a problematic sample or microscope setup with many restarts!
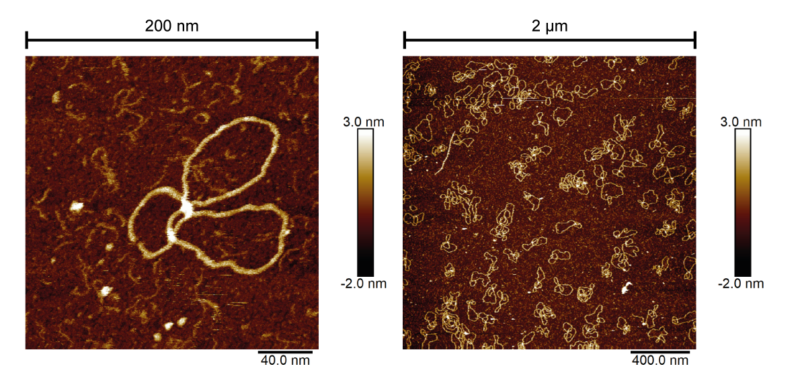
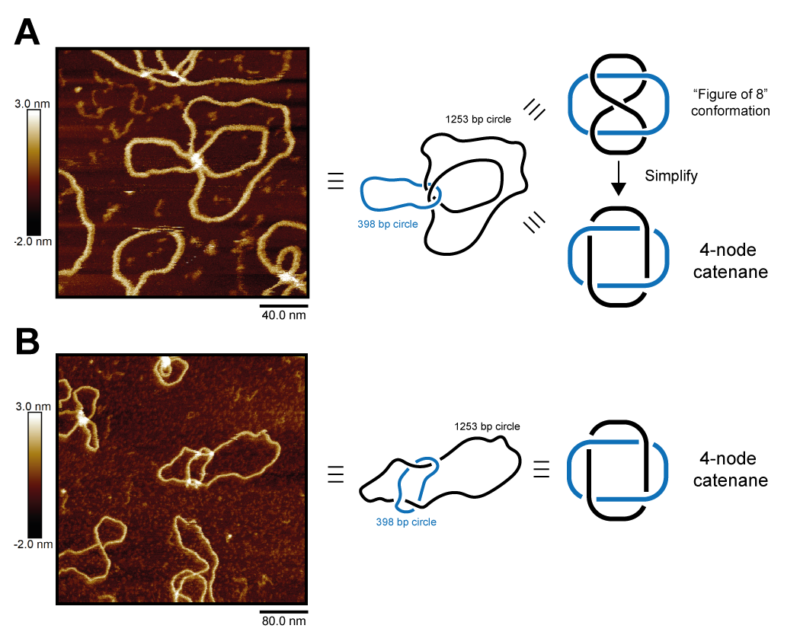
Across the month, I mainly studied a form of Xer product DNA where the catenated circles were 1253 base pairs (bp)p and 398 bp long. I aimed to capture a selection of high-resolution images of uneven four-crossing catenane DNA to observe the conformation and the directionality of topological crossings. Across the month I collected 47 high-resolution AFM images of uneven 4-cat DNA – and many more images of other samples and conditions. It was even possible to see the striations of the DNA bases on my best images.
The scanning field sizes of these images ranged from 200 nm2 to 2 μm2, at the lowest size containing a single example of catenated DNA. Those 47 good images contained around 250 complete and potentially traceable DNA catenanes. The total number of images I took was very large, but I won’t count the images of low resolution, poor sample quality, high levels of artefacts, or those with too high or low DNA concentration.
The DNA catenanes adopted two distinct conformations in the captures taken during my visit. This difference was caused when the larger of the two catenated circles crosses over itself into a figure-of-8 shape. By tracing the crossings of the DNA, we could determine their direction and show that the two visually distinct conformations of the DNA catenane are actually topologically identical.
The Microbiology Society Research Visit Grant gave me the chance to learn AFM of DNA from a leader of her field. Going forward my collaboration with Dr. Pyne will continue. In the short term we’re thinking about how we could improve analysis and interpretation of the image data. Right now, all image tracing and interpretation of the AFM DNA topology is done by hand, which is very time intensive! It’s our hope to automate the process.
We hope that by developing these techniques, we will soon be able to apply them to new situations in the field of microbiological DNA-protein interactions.