Genomic data helped us during COVID-19. What other data can we use in the future?
My name is Dr Ash Porter, and I am a postdoctoral researcher with the Duchene group at the Doherty Institute within The University of Melbourne, Australia. I’m an evolutionary biologist who has a particular fascination wildlife disease and zoonotic viruses. I use a combination of biological knowledge with computational methodology to study how viruses emerge and evolve in new hosts. My research revolves around data: data can help us unravel and understand pathogens from hundreds of years ago. Data can help us monitor outbreaks and inform public health policy. Data can even be used to explore what might happen in the future and help us prepare for the next pandemic.
As I mainly work on zoonotic viruses, you might think its strange that I don’t think viruses are our enemies. They exist, like we do, in the global ecosystem, and they have played their part shaping human evolution. In fact, most of the recent outbreaks of viruses have been caused by human activities, such as climate change, land use change, and breaching wildlife habitats. Viruses infect your pet, the veggies you eat, the bacteria that live in your gut, and you (they are even in your DNA!). Most of the time they don’t cause any harm, but sometimes they cause catastrophic pandemics. I believe in taking a proactive approach to understanding as much as we can about zoonotic viruses, to better prepare us for “the next COVID-19”.
When I started my work at the Doherty Institute, it was 2020 and many of us were attempting to understand SARS-CoV-2. One of the first project ideas that I suggested was to use some novel methods (Lemey et al., 2020) to explore how the virus moved into Australia during the first wave of the pandemic.
Australia is an interesting case study when it comes to pandemics. Being an island nation, it is much easier to close our borders and to potentially halt the introduction of pathogens. For example, during the deadly influenza pandemic of 1917-1919, sometimes misleadingly referred to as the “Spanish flu”, Australia enforced both maritime and land quarantine measures to attempt to slow the spread of the virus. The city of Sydney even mandated the use of masks, along with the closure of schools and places of entertainment (sound familiar?).
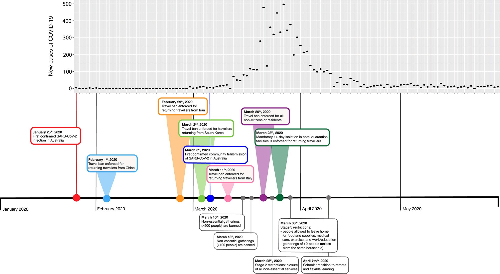
At the beginning of the COVID-19 pandemic, Australia enforced a range of measures to reduce the impact of SARS-CoV-2 on the population (Figure 1). Due to the social distancing measures, there were probably lower levels of community transmission during this stage of the pandemic (people weren’t spreading it to each other). However, there was still a rise of new cases being detected – and some of them were travellers from outside the country. Importantly, in Victoria, those who tested positive upon entry to Australia had their recent travel history recorded.
The Microbial Diagnostic Unit Public Health Laboratory (MDU PHL) and I were very lucky to have access to an extremely special dataset: the travel history of these travellers, which was linked to the genomic sequence of their SARS-CoV-2 infection.
What makes this special? Having extra data that is linked with genomic sequences is not very common – sometimes, all we have is what date the sample was collected. Other useful information can be the location of collection, what species it was sampled from, or if there was any important medical history of the individual (i.e. chronic infection, vaccination status).
Sometimes having just the sequence data and the date of collection is enough information for evolutionary biologists to figure out how the virus is spreading and evolving. However, SARS-CoV-2 evolves pretty slowly (for a virus), and unfortunately, most of the sequences that were generated were collected from high-income countries. This means that there is a major bias in the dataset towards sequences from countries like Australia, which had a lower caseload, but had the resources to sequence many of the detected cases. As an example, during the same period, Australia had a sequencing proportion (the number of cases that were sequenced) of over 50%, whereas South America sequenced 0.3% of cases.
If we were to try and model the movement of SARS-CoV-2 based on sequence data, it would appear that countries with a higher sequence proportion (such as Australia) were the “epicentres” of the pandemic. In order to produce more realistic estimates, having access to the travel history metadata enabled us to implement that extra information into our model.
To use a metaphor, if my friend and I both went out and bought a copy of the 2020 Booker Prize winner “Shuggie Bain” by Douglas Stuart to discuss at our monthly book club. Because we love books and data, we also track how many people come to our book clubs, and therefore, how many copies of each book are present. Likening this to an infectious disease outbreak – each “book” is the virus infecting a person.
Upon meeting, we might be slightly confused to why our two copies of the same book had different covers and punctuation styles. It might take a discussion to unravel that they had bought their version while they were on a recent holiday to the USA, whereas I had sourced mine from a local bookstore. Although both books were present at our local book club in Victoria, the novels are slightly different versions of the same book, based on their origin of publication. We can compare this to two people in the same current location having slightly different lineages of SARS-CoV-2, based on where each person was infected in the past.
If we took our usual tally at our book club of how many people were present that day (and how many copies of the “book” were present), the history of the origin of each book would be lost – we would just know how many copies of the book were present at our Victorian book club. Obviously, it wouldn’t really matter for a book club to know about the origin of publication for the books brought by the participants. However, this kind of information can be very useful for phylogeography.
To translate that to our project, we were able to tell our model that some sequences, even though they were collected in Australia, were most likely the result of an infection overseas (i.e. recent travel history). We thought this extra layer of information would help generate more accurate results – but as it turns out, the travel history metadata was essential for the model to work.
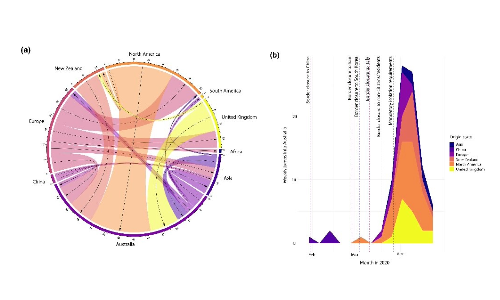
So, what did our analysis tell us? As you might expect, Australia had plenty of SARS-CoV-2 imported from other countries (Figure 2). As we anticipated, it didn’t really play a role as an “exporter” (i.e., Australia didn’t spread the virus as much to other locations, Figure 2a). You can see there was a “spike” in importations around mid-April before there was a rapid reduction. We can’t say what caused the slowing of importations – but it was likely a combination of the control measures introduced, such as the mandatory isolation requirements (Figure 1, 2b).
This project had a range of people from different backgrounds working together: our collaborators at the Victorian Department of Health, epidemiologists, microbiologists, and experts in public health and phylodynamics. However, the point I want to make is: even with this innovative methodology and the range of experts we have in Australia, we wouldn’t have been able to generate these results without the travel history metadata.
Unfortunately, collecting and sharing metadata has many barriers (e.g. ethics, data ownership). The quality and availability of publicly available metadata presents barriers for its usage in most SARS-CoV-2 research.
We strongly recommend caution when applying phylodynamic and phylogeographic models to the global SARS-CoV-2 dataset without using relevant metadata, as we know that there is sampling bias present, and that it will potentially produce misleading estimates. For the ongoing COVID-19 pandemic and future outbreaks, we need to be sure that the estimates we are producing can inform the most appropriate public health policies.
We hope that collecting and sharing metadata will become more common practice, and that we can work towards a global, coordinated response for data collection and modelling. This will be key for managing the ongoing COVID-19 pandemic, along with preparing for future pandemics.
Reference
Lemey P, Hong SL, Hill V, Baele G, Poletto C, Colizza V, et al. Accommodating individual travel history and unsampled diversity in Bayesian phylogeographic inference of SARS-CoV-2. Nature communications. 2020;11(1):1-14.
Thumbnail image credit: Doherty Institute