Modernising bovine tuberculosis epidemiology with whole genome-based approaches – valuable new possibilities
My name is Adrian Allen, I’m a Principal Scientific Officer at the Agrifood and Biosciences Institute (AFBI), Belfast, Northern Ireland (NI). I lead the pathogen genomics laboratory, which produces data for epidemiological tracing of important veterinary diseases.
We apply molecular methods to epidemic and outbreak investigations of the causative organism of bovine tuberuclosis (bTB), Mycobacterium bovis. Previously, we developed the then state-of-the-art multi-locus VNTR analysis (MLVA) to produce genetic fingerprints for M. bovis isolates.
We then established structured, longitudinal, herd-level M. bovis MLVA type surveillance and mapping, which disclosed the striking geographical localisation of pathogen types, showing the wider bTB epidemic was a series of geographically clustered micro-epidemics caused by specific MLVA types. This enabled epidemiological investigations; when a case of a particular MLVA type was observed outside its typical geographic area, one could infer that this new case likely linked back to a source within the ‘core’ geographic range for that MLVA type. Some of these MLVA core ranges were very large, many being county sized.
As informative as MLVA typing has been, it is hampered by limited resolution, relying on indexing variation at only eight genomic sites. For the most common types, different farms could have breakdowns caused by indistinguishable M. bovis types, making traceback difficult. Imagine looking for the source of a needle in a huge county sized haystack made up of smaller bundles of hay each containing identical needles to the one you’re looking for. So, there was a need to improve epidemiological precision.
Whole genome sequencing (WGS) is revolutionising molecular epidemiology, producing the highest resolution data available. By analogy to the world of publishing, using MLVA typing is like comparing two editions of the same book to see what the author has changed, by only looking at 8 words in the whole text. Much better to read every word to make a proper comparison. This is what genome sequencing does, and the benefits it delivers are quite striking.
In our latest article, we sought to demonstrate to stakeholders and policy makers, just what those benefits are and how they can improve disease control schemes. We focused on one very common type – MLVA type 1.140. From previous whole genome phylogenetic studies, we conclude that these MLVA types represent the deeper ancestry of local M. bovis and robustly define the major lineages – major limbs of the wider tree of pathogen diversity.
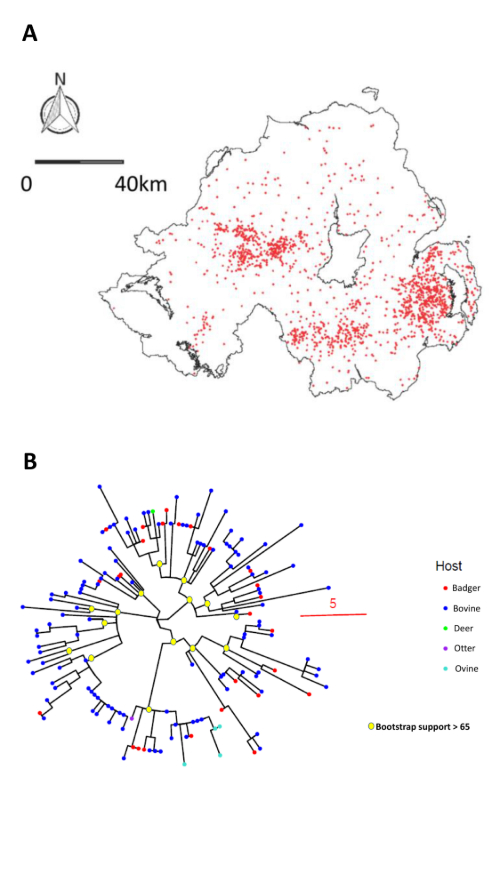
The 1.140 lineage is widely dispersed across NI, with three distinct foci in the east, west and south of the province as illustrated by the map of 2108 MLVA typed cases at associated farms from 2000-2022 (Figure 1A). The core range of this lineage covered ~1000 km2 – a considerable haystack. We selected 148 stored isolates representative of the three locations over the same period, genome sequenced them and performed a phylogenetic analysis. This split the MLVA lineage into multiple sub-lineages / minor tree branches (Figure 1B).
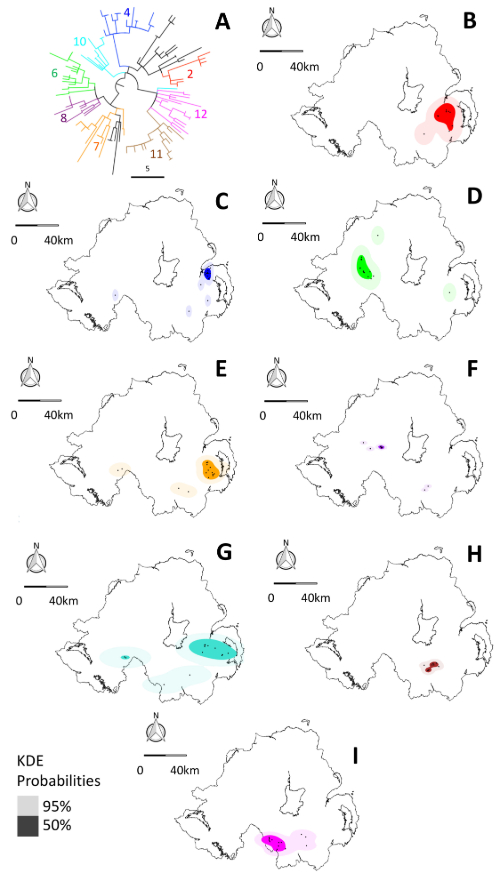
We could then split this tree up into useful sub-branches by applying a relatedness cut-off – we wanted to identify all isolates that were within 15 mutations of each-other to find cases of linked historical and recent transmission. We robustly identified 8 sub-lineages, whose isolates mapped to discrete geographic locations in NI (Figure 2). Sub lineage core ranges were considerably smaller than those defined by MLVA. So, WGS successfully split the haystack into smaller, much more epidemiologically informative, component stacks, reducing the number of places a potential source ‘needle’ could be hiding.
As well as refining the phylogeographic signal, genomic data provided an additional benefit – the ability to infer fine-scale relatedness between isolates. Some isolates belonging to specific sub-branches lay outside of the core ranges established by applying the 15-mutation cut-off. However, because we knew they were closely related to isolates within the core ranges, we could attempt a trace back to those refined locations using animal movement data. We could track ~70% of outside core range isolates back to cattle movements originating from farms within the core range or at most 4 kilometres from its edge.
This enhanced traceback will improve disease outbreak investigations and is perhaps the obvious routine, translational use for genomic data. However, there are other useful outputs. Having complete genome sequences enables determination of the molecular clock rate at which pathogen DNA mutates in a way that discrete MLVA type data cannot. Time-stamped phylogenies which permit inference of times at which major lineages and sub-lineages emerged, can then be estimated. This is useful for determining the history of how pathogens spread over landscapes. For our 1.140 lineage, we were able to show that the extant southern and eastern members diverged at much the same time around 30-40 years before present. The western sub-lineages however diverged later around 23 years before present and shared most recent ancestry with eastern lineages. We inferred that the 1.140 lineage was introduced to the west of NI from the east of the province 23 years ago and that this long-distance seeding was likely facilitated by unwitting movement of infected cattle.
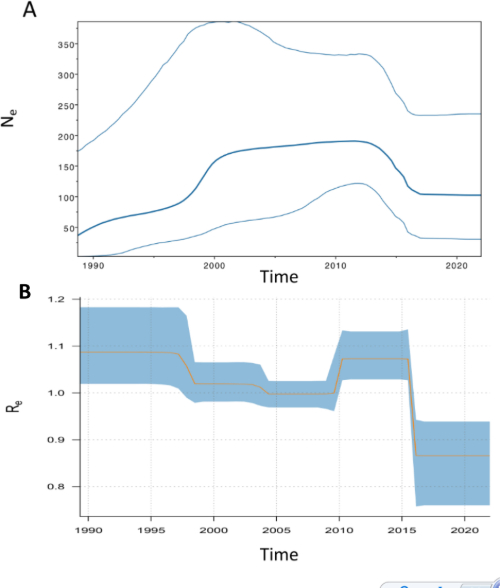
From time-stamped trees, we can also infer important epidemiological parameters such as pathogen population size, the epidemic’s reproductive number (RE), and how they vary over time. The extant population of the 1.140 lineage emerged from a common ancestor ~40 years ago, likely after a population bottleneck caused by the introduction of bTB eradication schemes in the mid-20th century. Population size increased steeply in the early 1990s and 2000s, plateauing for much of the noughties, only to fall in 2015 (Figure 3A). The RE inferred over the same period closely tracked population size as expected, being significantly above 1 when the epidemic expanded and population grew, hovered around 1 when the population plateaued and then fell as the population decreased in 2015 (Figure 3B). These demographic patterns, inferred from only 148 M. bovis genomes, tellingly recapitulated what we inferred from long-term MLVA-based surveillance from thousands of samples. This was a pleasing congruence to note and testament to the power of WGS-based methods.
Overall, we demonstrate just how useful transitioning to WGS based molecular epidemiology can be – not only does it significantly enhance disease trace back, but it also facilitates tracking of an epidemic’s progression, growth and spread over a landscape. With the analytical tools we have described, we hope to be able to provide a means by which policy makers and veterinarians all over the island of Ireland can monitor the progress of disease eradication and more effectively trace sources of infection.
Image: AFBI