How to write a graphical abstract
Posted on August 6, 2019 by Laura Cox
There are many ways to summarise and present your research, and graphical abstracts are becoming increasingly popular with journals and scientists. Condensing an entire manuscript, or PhD thesis, into a single figure seems like an impossible task to many. Visually representing any biological process can feel overwhelming, especially in microbiology where the main research subject is so small, but you don’t have to be an artist to make a graphical abstract. Here, we provide some advice on how to produce a graphical abstract and some key things to think about.

To celebrate the Microbiology Society’s 75th anniversary, ahead of our Annual Conference in 2020, we will be hosting a special one-day event to celebrate the impact of microbiologists past, present and future. Attended by a number of world-leading scientists, including Sir Paul Nurse, this ‘Fleming Showcase’ will observe the legacy of past Fleming Prize winners and will examine some of the most exciting science from around the globe.
Final year PhD students, and those within a year of completion, have been invited to submit their research in the form of a graphical abstract along with three bullet points explaining their research. Students with the most outstanding research will be invited to present it during a five-minute thesis slot during the Showcase.
What is a graphical abstract?
A graphical abstract, or visual abstract, is a single image that encompasses the central message of a piece of research. It can be used as an interactive way to publicise your research, making it stand out from the crowd, and disseminate your work to a wider audience. You can include three to four sentences of text to explain the image, but the less text the better!
Producing a graphical abstract:
A great place to start is by looking at some of the posters you may have produced to present at scientific meetings or conferences. These are already condensed versions of your research and contain some of your key findings and processes. From here, identify your main message and condense the research down into four to five sentences.
Now, sketch out some drafts of what the abstract could look like. Depending on the information you need to convey, this could be done in a number of ways, such as a flow chart, a diagram of a process or a series of panels illustrating key aspects of the research.
Choose a colour palette and stick to it. Ideally choose one or two main colours and use shades of these colours across the image. This will make your abstract look professional and consistent. Make sure you use the same font throughout the abstract – use different sizes and styles (bold, italic, light) to change it up and make the most important parts stand out.
Try not to make your graphical abstract too crowded; having some white space can make key elements stand out and prevent your message from getting lost. Think about every element on the page and consider its value to the piece. If it is providing essential information, keep it. If you think it is not adding anything to the story you are trying to tell, delete it or try something else.
Some things to think about:
Consider the figures already included in your research and see whether any of them could be adapted. Try not to be too specific, though. It is more about ‘telling the story’ of the research in a visual way.
Think about figures and other graphical abstracts you may have seen. Which have been good? Which have not been clear? Try to think about them critically and define what makes a figure clear and easy to understand, and how you can use this to improve your own work.
Think about your audience: What is their expertise? Be cautious using overly-technical language and make sure you define any abbreviations used. You can still use some words in the abstract, just make sure you use them wisely!
Software and tools:
There are many different types of software which can be used to produce a graphical abstract, some of which are easier to use than others. Even though Microsoft PowerPoint seems like a simple tool, you can use this programme to make professional-looking graphics. You can use one slide as the canvas for your graphical abstract.
Other software includes Adobe InDesign, Adobe Illustrator, Microsoft Publisher, CorelDraw and InkScape. There are so many more out there, so have a browse around and find the one that works best for you.
You can download online images or use your own. If you have some photographs from your research, include them if it is relevant. If you are using images taken from online, or from a colleague, don’t forget to get permission from the owner and credit any images that you have used that are not your own.
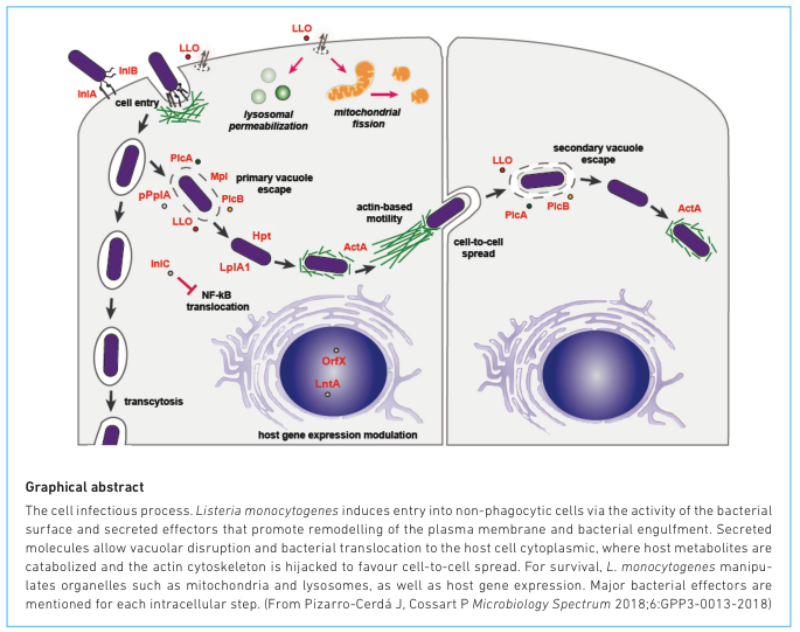
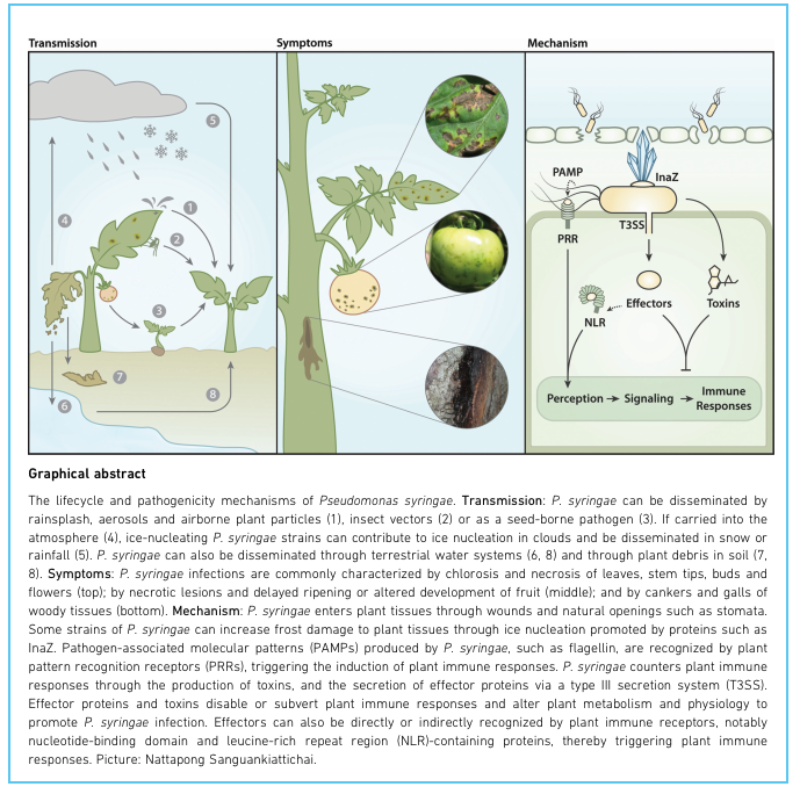
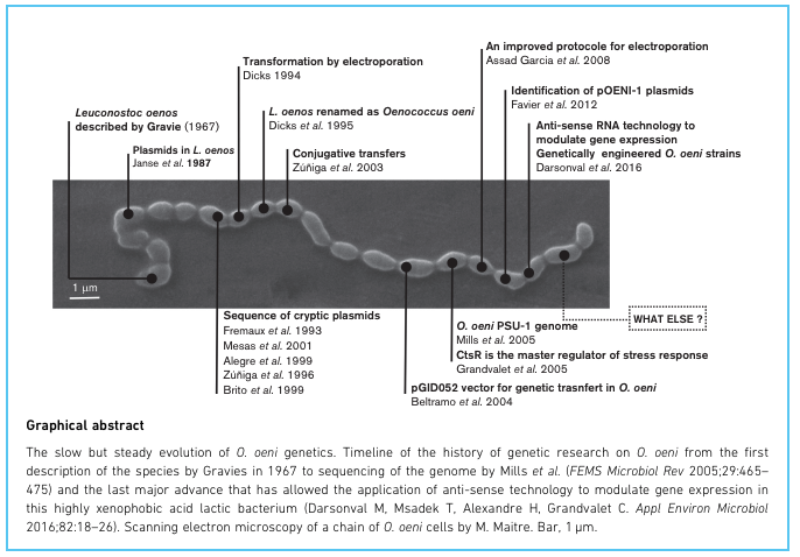
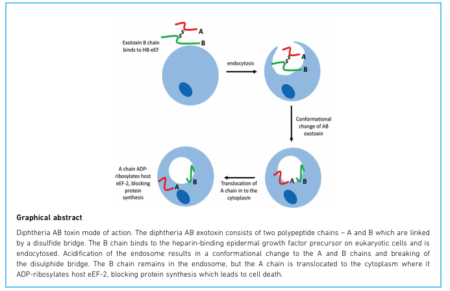
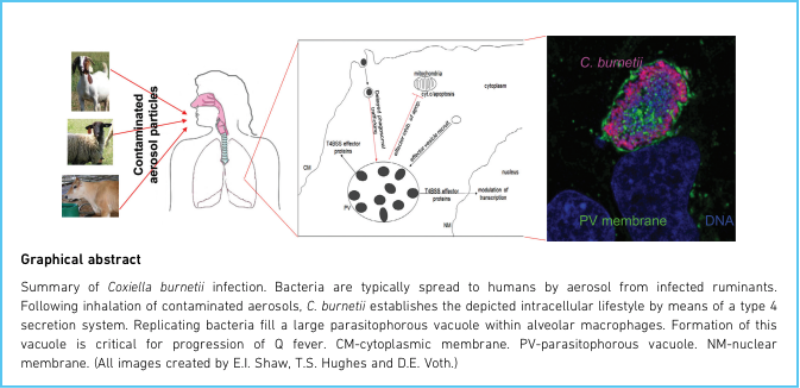
Some more examples of graphical abstracts: